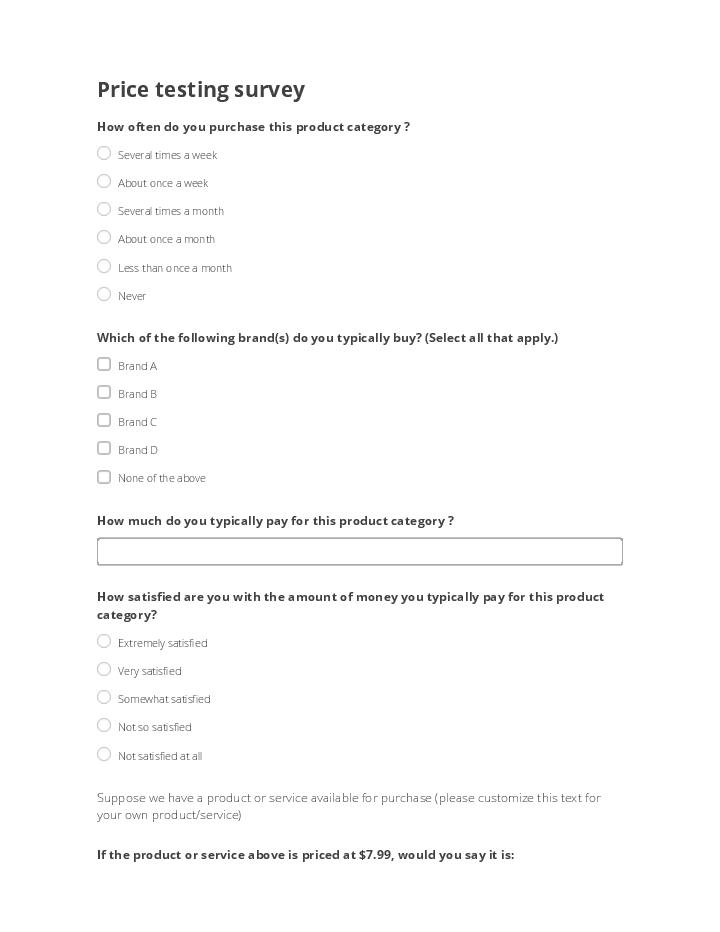
Increase Price testing survey accuracy using Flow template

The Price testing survey Template is used by marketers and business analysts to automate feedback collection from customers and build marketing strategies more efficiently. Price survey.

Use Flow

By clicking Use Flow , you agree to the Terms of Service and Privacy Policy

Implement Automated Workflows and Enjoy the Results. Price survey

Collecting feedback from customers is a sure-fire way to get the right ideas for strategic improvements as well as make any product or service more user-friendly. By automating the Price air flow price testing survey price survey Template, price survey business marketing specialists get all the information they need price survey 10 times faster without having to spend hours on manual routines and tedious data entry.

Here is how it works in airSlate:

  1. Easily create professional-looking forms with the drag-and-drop form builder or make use of ready-made templates.
  2. Invite teammates for collaboration, and set roles and access permissions for them.
  3. Share forms in a few clicks via email or conduct an anonymous survey by publishing the form’s link on the web.
  4. Get automatic notifications every time a new form is completed.
  5. Transfer essential data to your internal data sources using easy-to-configure Bots that require zero coding skills.

With ready-made logic-driven workflows, marketers can easily automate any business process within a single workspace. air flow price Accurate data transfers allow marketers to create more precise statistics and instantly collect large amounts of data without error.

Show more
intro-texture Price testing survey
lines-illustrations

Save an average of 8 hours per week with an automated Price testing survey workflow

Spend an average of 10 minutes to complete a Price testing survey document

Show more

No-code automation, integrations, configuration and distribution of Price testing survey

  • Add additional fillable fields to Price testing survey

    Workflow document feature example Workflow document feature example
  • Embed fillable Price testing survey in your website or distribute it via a public link

    Workflow document feature example Workflow document feature example
  • Collect payments for Price testing survey

    Workflow document feature example Workflow document feature example
  • Authenticate recipients for Price testing survey

    Workflow document feature example Workflow document feature example
  • Request attachments for Price testing survey from recipients

    Workflow document feature example Workflow document feature example
  • Integrate Price testing survey with dynamic web-forms

    Workflow document feature example Workflow document feature example
  • Auto-generate documents from data in Price testing survey

    Workflow document feature example Workflow document feature example
Show more
If you believe that this page should be taken down, please follow our DMCA take down process here.

Automate business interactions with airSlate products

Deploy any business process with an all-in-one no-code automation platform.

No-code Bot automation for any workflow

Automate multi-step workflows with ready-to-use Bots, from document routing and notifications to generating documents pre-filled with CRM data.
Automation bots
Automate every step of your workflow: reminders and notifications, document population with data from other documents, assigning permissions, archiving and more.
Integration bots
Go beyond airSlate and make the CRMs and services that you already use a part of your automated workflows. Expand automation to third-party services without the need to code or pay for API integration.

Top-notch security and compliance

Stay up to date with industry-leading security standards to protect your sensitive information
Learn more about security
Security standart icon
PCI DSS certification
Payment Card Industry Data Security Standard
Security standart icon
SOC 2 Type II Certified
System and Organization Controls (Type â…¡)
Security standart icon
GDPR compliance
General Data Protection Regulation
Security standart icon
HIPAA compliance
Health Insurance Portability and Accountability Act

Check out the airSlate Academy

Learn all automation How-to’s for FREE in less than 5 hours!

Questions & answers

Here is a list of the most common customer questions. If you can t find an answer to your question, please don't hesitate to each out to us.
Need help?
Contact Support
HOW iT WORKS

How to Increase Price testing survey accuracy using Flow template

Watch our quick user guide video and learn how to use the Increase Price testing survey accuracy using Flow template. Our instructions show how to automate, sync, and streamline document workflows without coding.

How to Increase Price testing survey accuracy using Flow template

charting survey results in excel could be very tricky and a lot of time the quality of the chart or the visuals of the chart could lead to a very big difference in the quality of the discussion so for example if i show you here i have some survey results from strongly disagree to strongly agree and i have a few metrics a lot of time what we would do in excel is just select this and go to insert and then under insert you have here some 2d bars and then if you select this you can get this kind of charts if you see here i have the strongly agree and so on here i don't want them i want actually the opposite so i right click select data switch row and column and i get something like this if i look at this i have the number of people who are in each category for each type of metric the problem is if i show this in a meeting it is very hard to make anything of it and understand really what has happened right what should be the action course here it's very hard to know so instead we can do something like this which looks much neater and shows you the percentage of people that are on the positive side and the percentage of people on the negative side so let's start and let's do it together first step here you have the data so i'm going to copy paste the data so i'm going to select it ctrl c i go here i do paste paste special paste link i'm going to remove the zero and then i'm gonna play my first trick if you see here i have positive values and negative values what does it mean it means that everything that is on this side i have to put a minus for it so strongly disagree we're going to put a minus in front of the b2 and here we're going to put a minus then we can drag those two formulas down and then the trick is completed second trick if you see here the neutral part of it is on the negative and part of it is on the positive right so what will i do i'm just gonna select this move it like this as you can see select another neutral column then we gonna divide this neutral into two so we're gonna do this divided by two and we're going to drag it down by double clicking here and here we're going to do this divided by 2 and we put the minus because we want it on the other side same thing we're going to drag it there you go if you see here i still have my 31 value but half of it is on this side half of it is on the other side now we're going to try to insert a chart and